
Reports & analytics
See how the business is performing — revenue trends, project activity, inventory utilization, and financial metrics — in one place.
Open in Stageory- 1
Open Reports & Analytics
Find it in the sidebar.
- In the left sidebar, under Management System, click Reports & Analytics.
- This is your live performance dashboard — revenue, projects, and inventory, all on one page.
app.stageory.com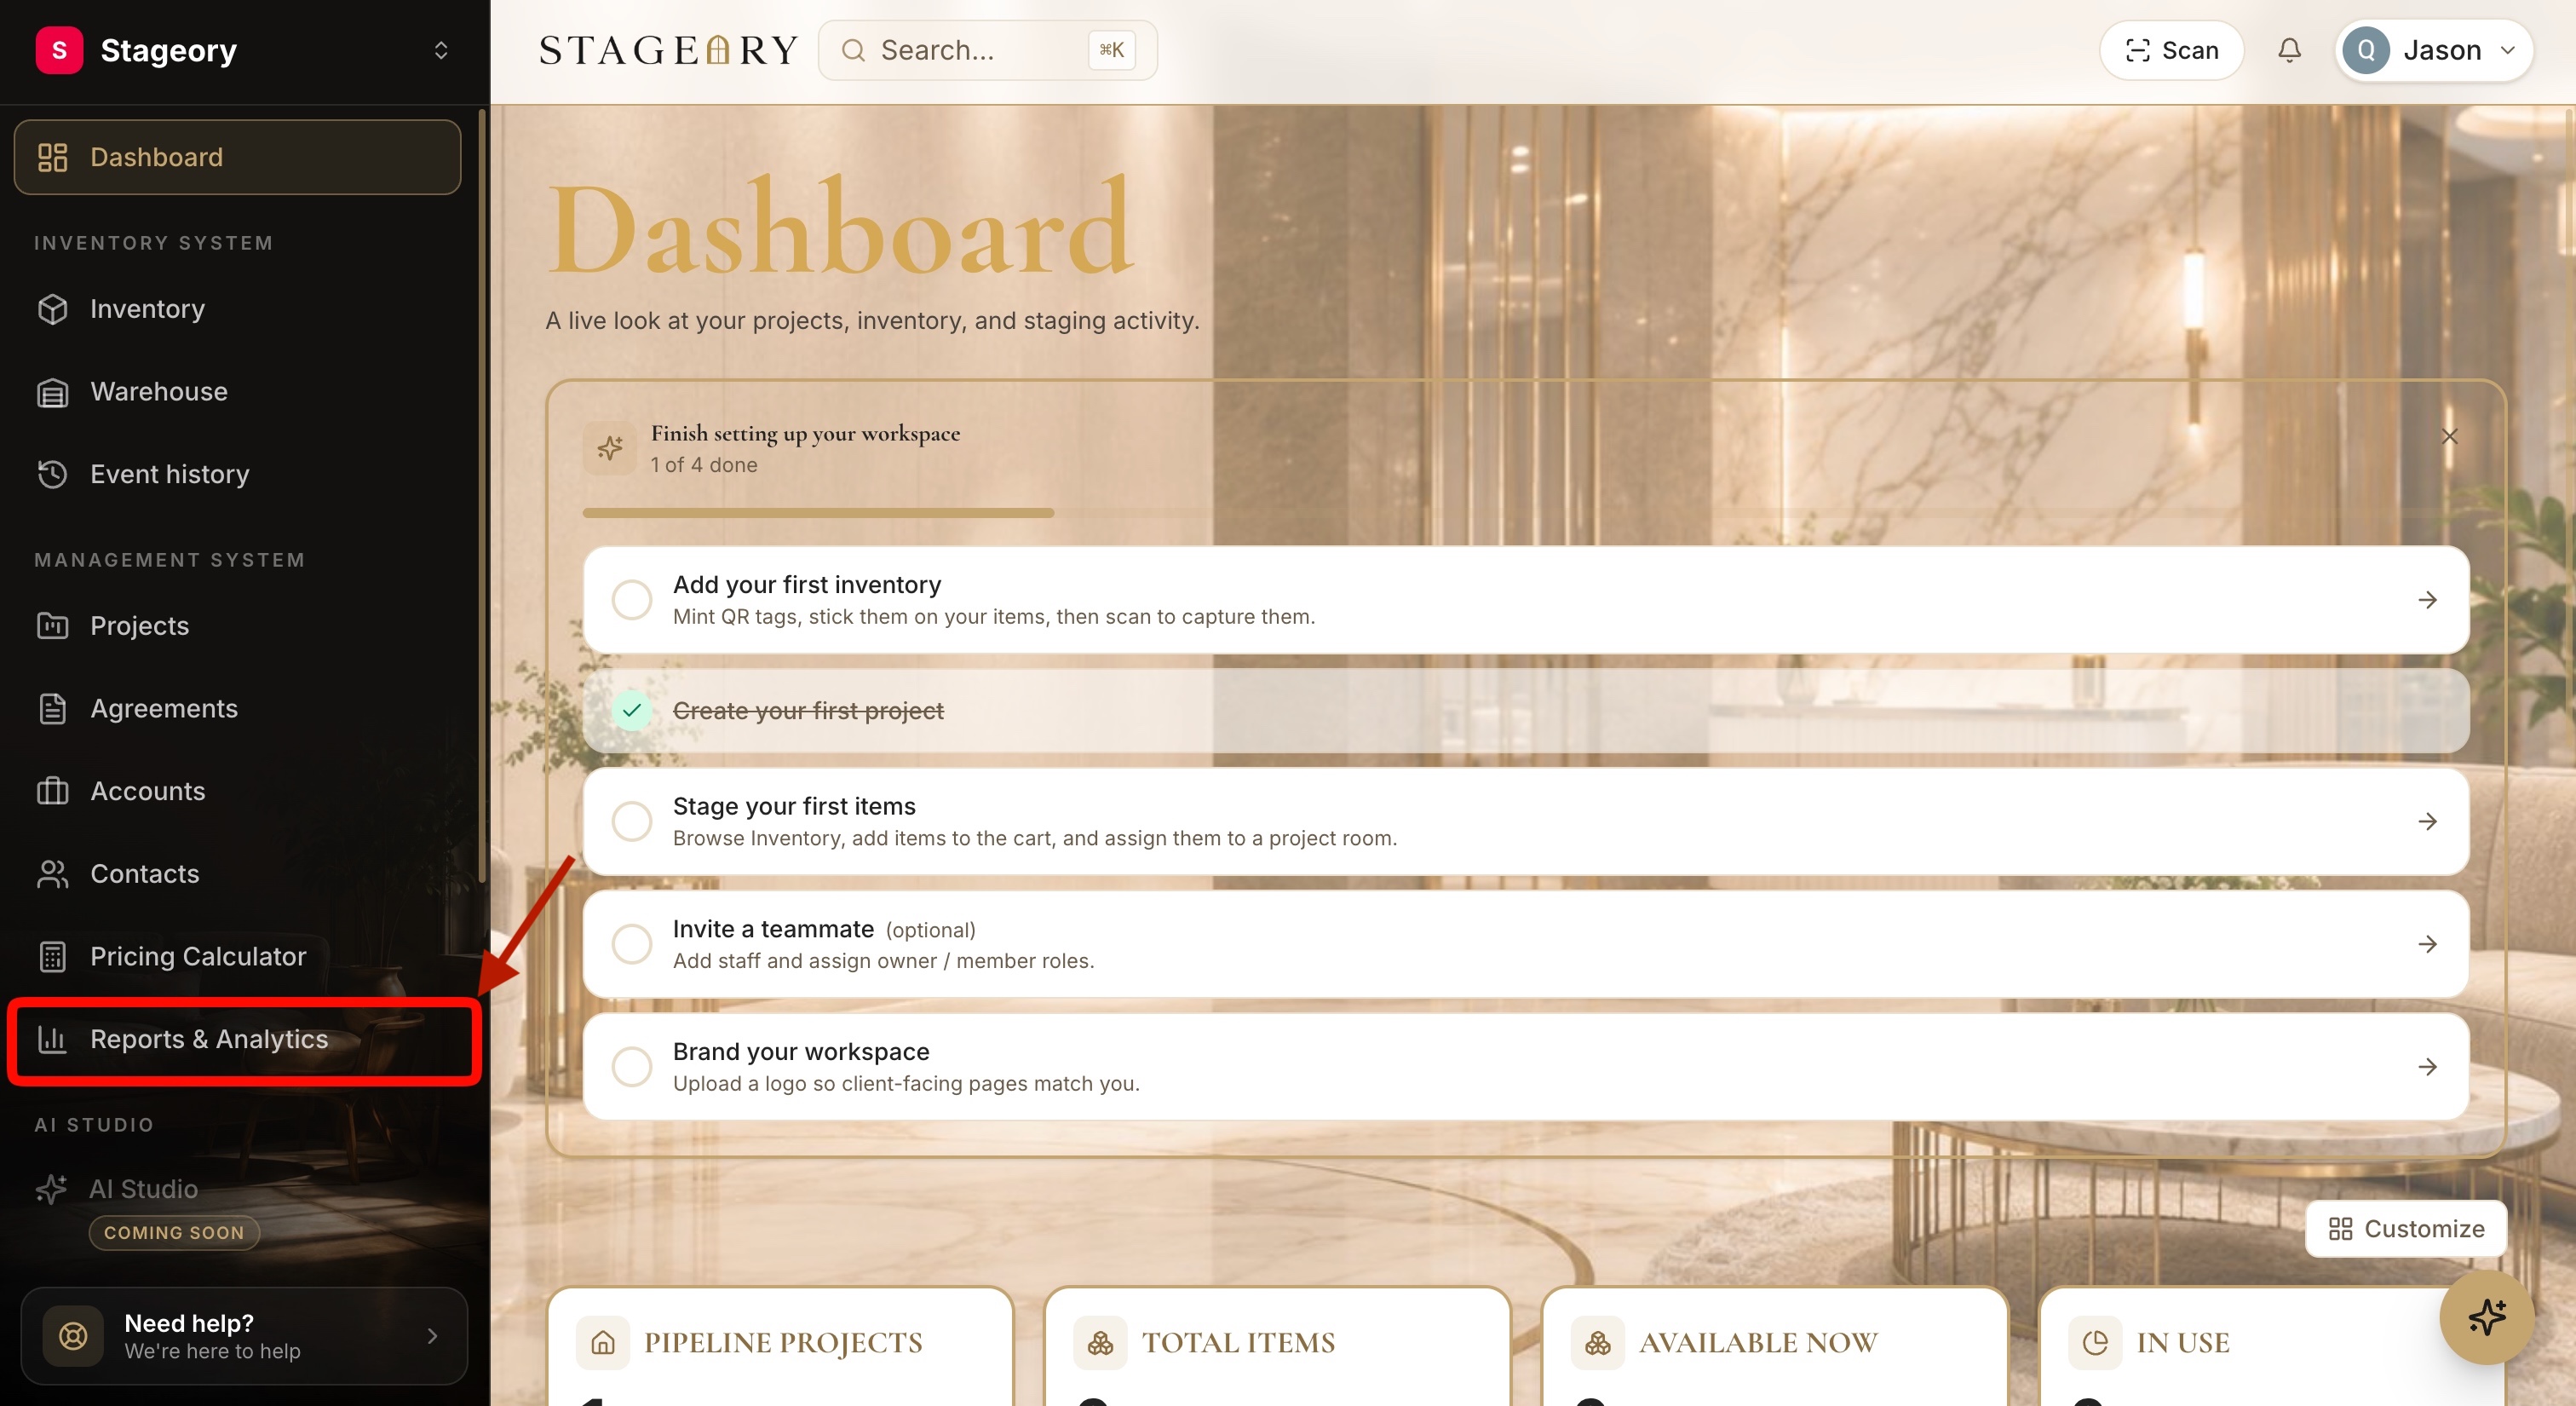
- 2
Pick a view and a time period
Scope what you see.
- Switch between the three tabs at the top: Financial, Project, and Inventory.
- Set the range on the top-right — enter a custom From / To, or tap a quick filter: 7d, 30d, 90d, or 1y.
- Every number and chart on the page updates automatically for the range you choose.
app.stageory.com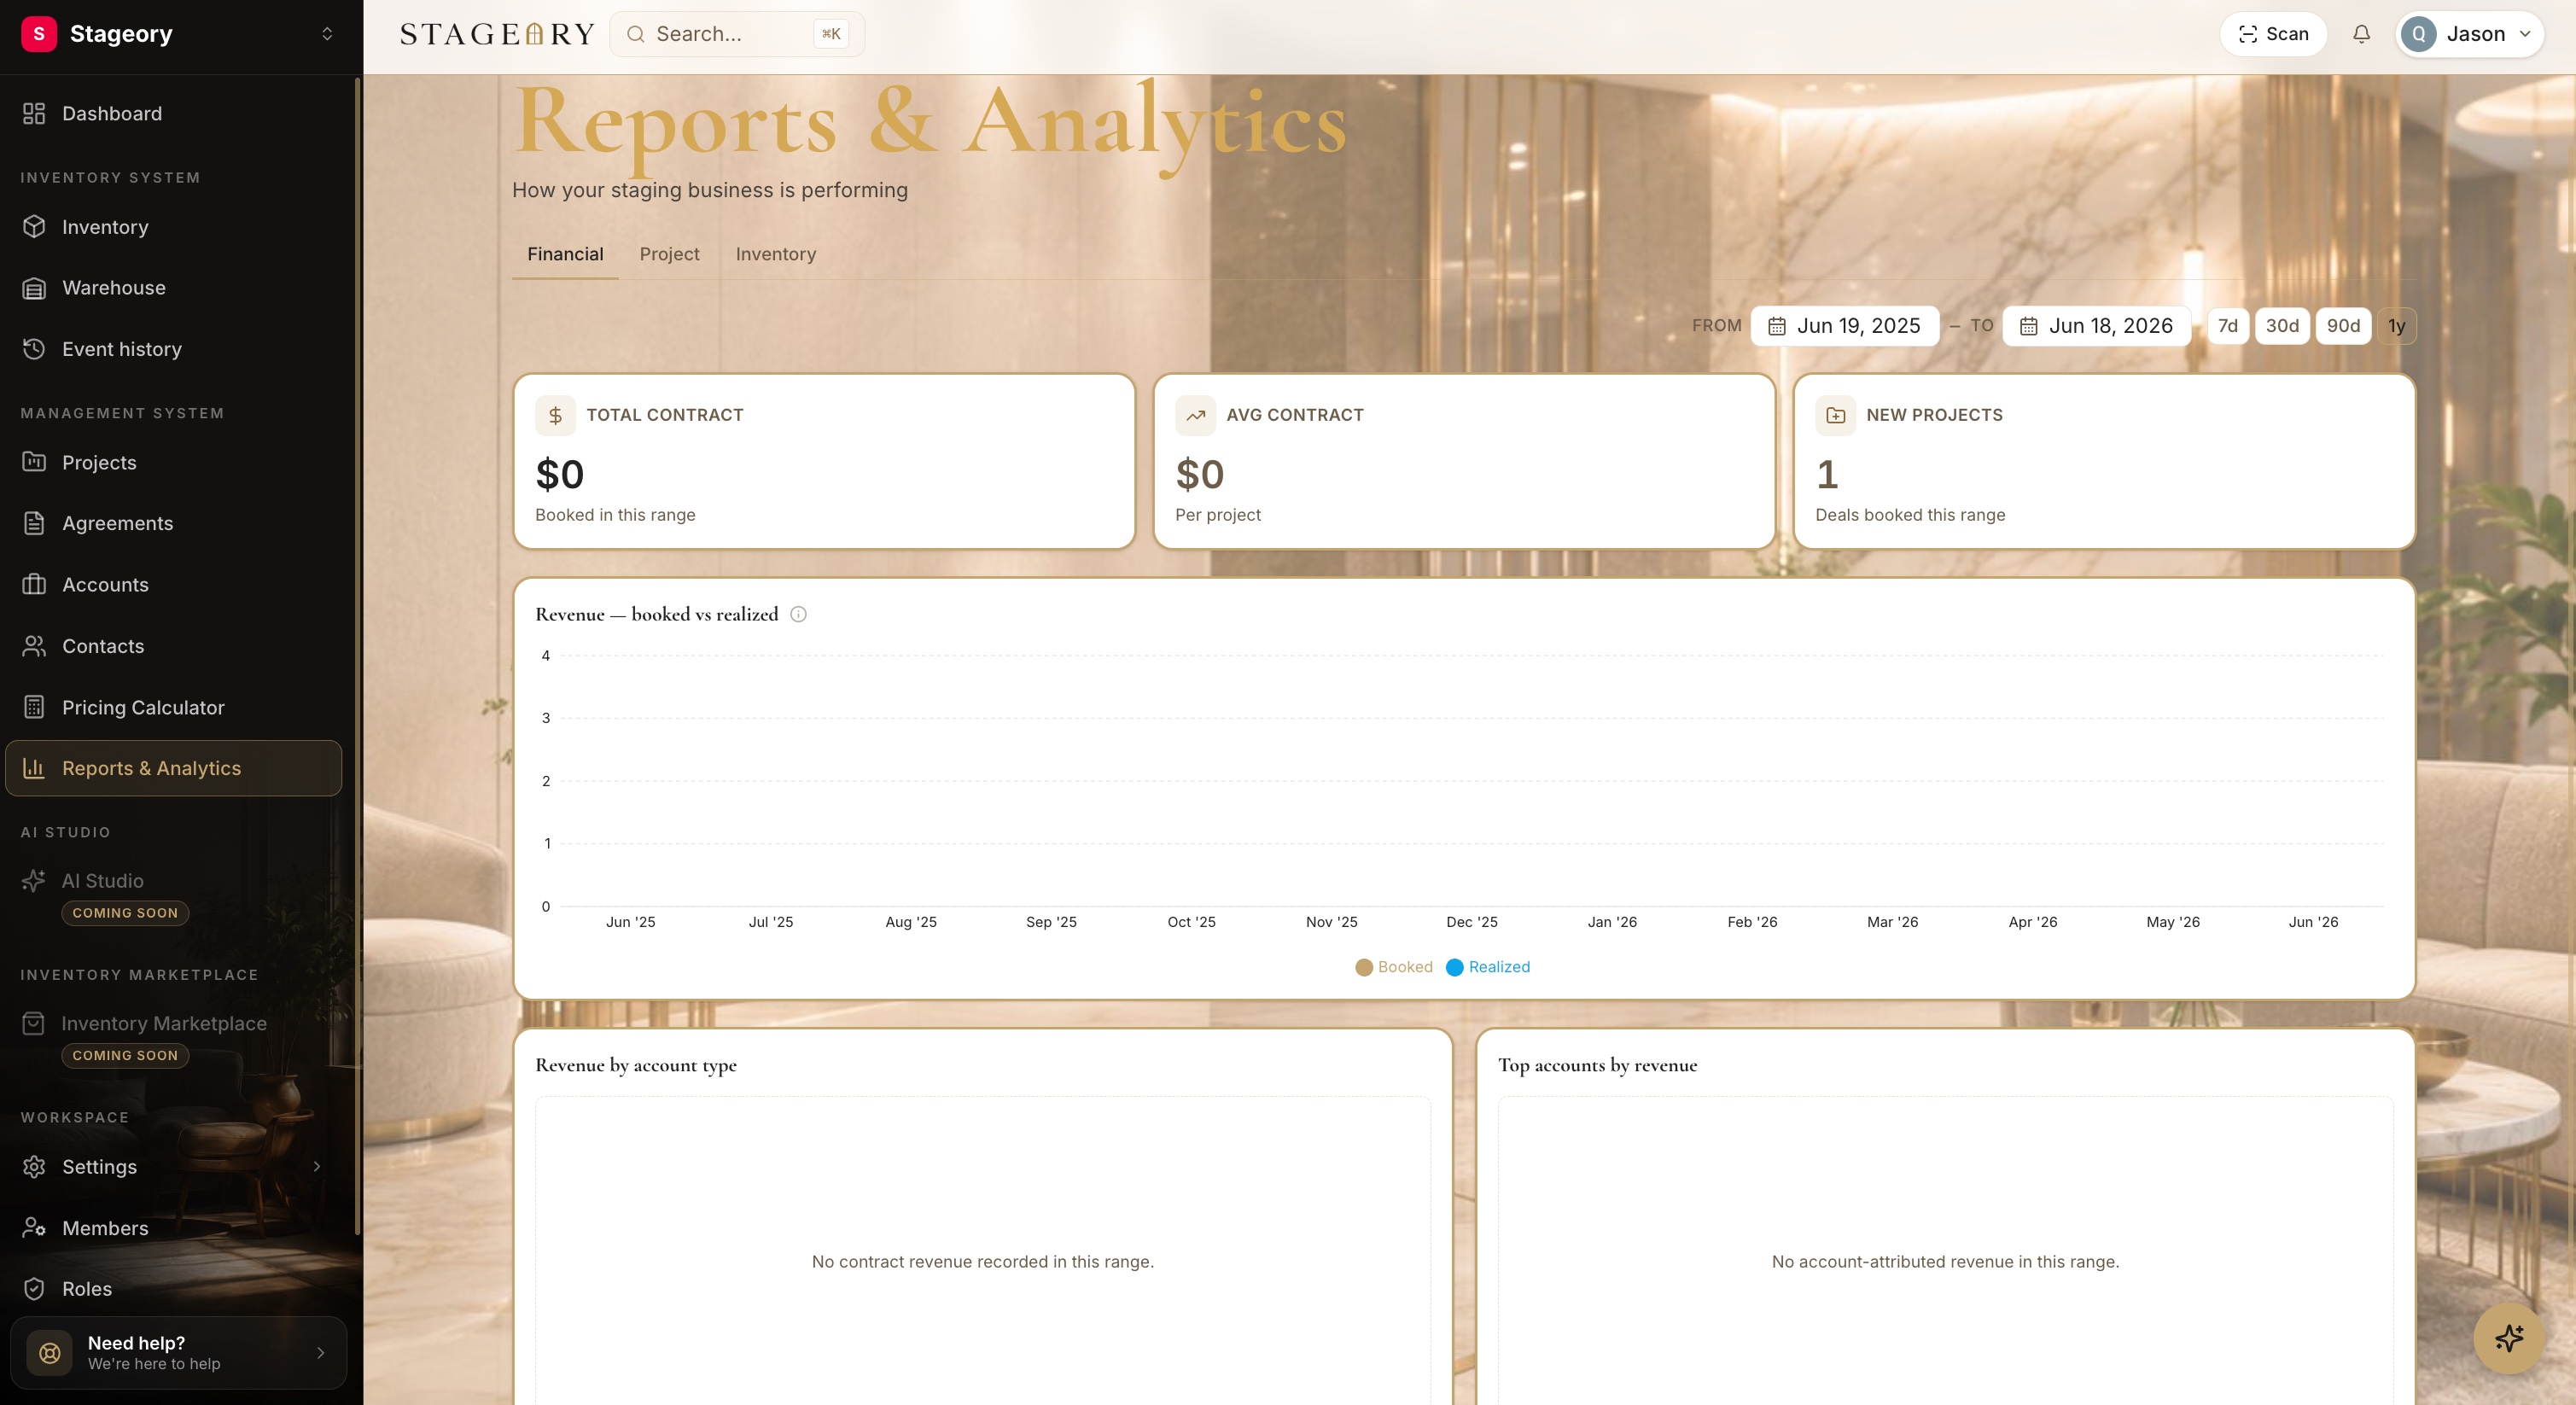
- 3
Read your headline numbers
The three cards up top.
- Total Contract — the value booked in the selected range.
- Avg Contract — average value per project.
- New Projects — deals booked in the range.
app.stageory.com - 4
Study revenue and top accounts
Trends and where money comes from.
- The Revenue — booked vs realized chart compares what you booked against what you actually collected, month by month.
- Revenue by account type and Top accounts by revenue show where revenue is concentrated and which customers drive it.
app.stageory.com
Tips
- The date range applies to every card and chart on the page at once.
- Booked is contract value committed; Realized is revenue actually collected — watch them converge as invoices get paid.
- Empty sections (No revenue recorded in this range) just mean nothing matched the period — widen the range to see history.
Still need help?
Can't find what you're looking for? Our team is here.